
Prove the impact of your internal communication.
How many employees actually received the information? Which teams are disengaging? Which formats work? Answer with reliable figures, and leave with an action plan.
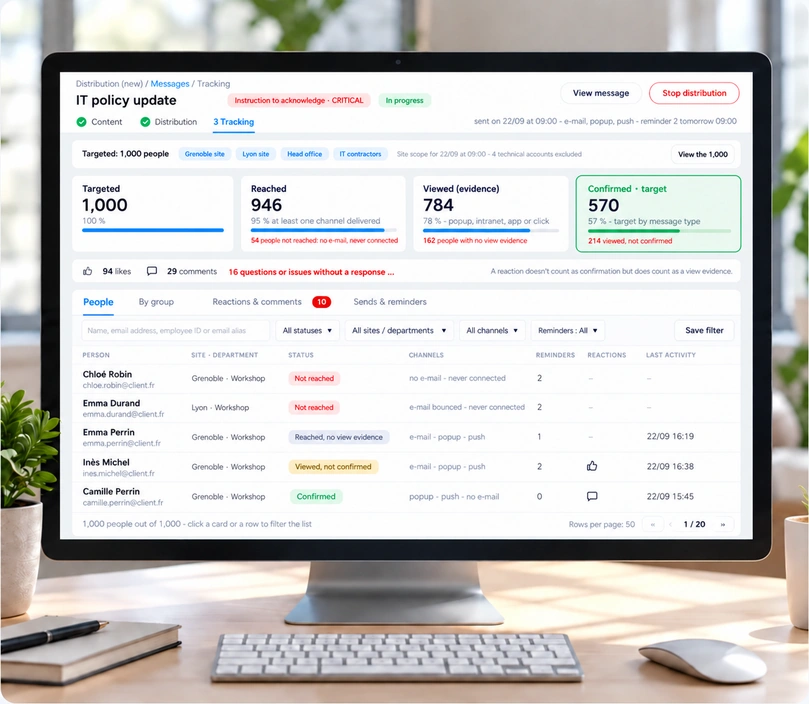
Targeted, reached, seen, confirmed: you know who to remind.
What you are asked, and what you will be able to answer.
“Are people reading?”
The actual reading of each communication, compared with your averages and those of comparable companies.
“Who are we not reaching?”
The sites, jobs and populations that are disengaging, and the channels that would suit them better.
“What needs to change?”
Concrete recommendations: timing, formats, frequency, channels. And the option to apply them in one click.
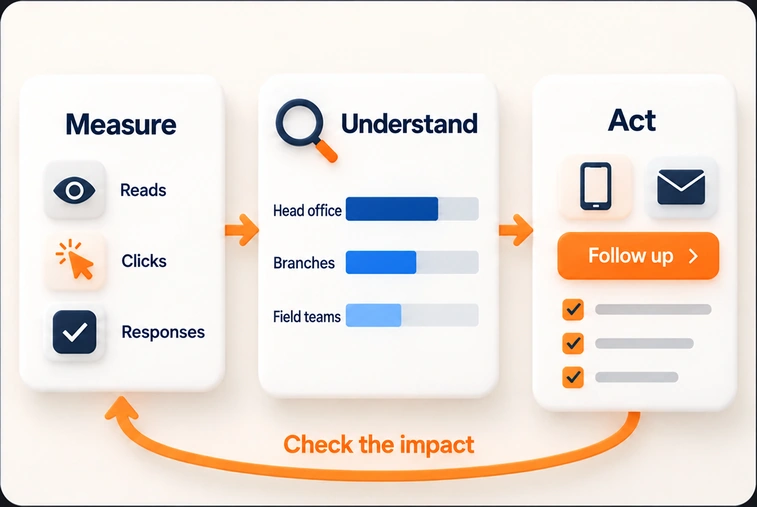
Measure, understand, act.
Measure with reliable signals
Reads on the intranet and app, quiz and survey responses, clicks: solid measures, with their limits stated.
Compare to understand
By population, by type of message, over time: the gaps reveal what works and what does not.
Act, then check
Remind a population, change channel, space out sends, then see the effect the following month.
Measure communication, never people.
Results by population
Named tracking is limited to receipt and confirmation of messages. Analyses and reports are always presented by site, job or entity.
Small groups protected
No result is shown for a group too small to guarantee anonymity.
Verifiable figures
Statistics are calculated by the platform. AI comments on them, it does not invent them.
The modules involved.
Statistics are included in every plan. The AI monthly report is an add-on.
Questions about measurement.
Are email opens reliable?
Not entirely: some email clients hide or simulate them. That is why our analyses rely first on reads in the intranet and app, clicks and responses, and clearly flag the estimated share.
Can we compare ourselves with other companies?
Yes. The monthly report places your results against comparable companies, based on aggregated and anonymised data. No client's data is visible to another.
Is the data used to assess employees?
No. Statistics measure the reach of your communication, not people. Results are presented by population, and no result is shown for a group too small to preserve anonymity.
Can we share the report with management?
Yes. The monthly report is designed to be read in two minutes and can be exported for your presentations.
Do you know who actually reads your messages?
In 30 minutes, we show you what your current statistics do not tell you.