
Don't just count the sends. Understand their impact.
Reads, clicks, responses: every communication has its statistics. And every month, an AI-written report tells you what worked, who you are not reaching and what to do next.
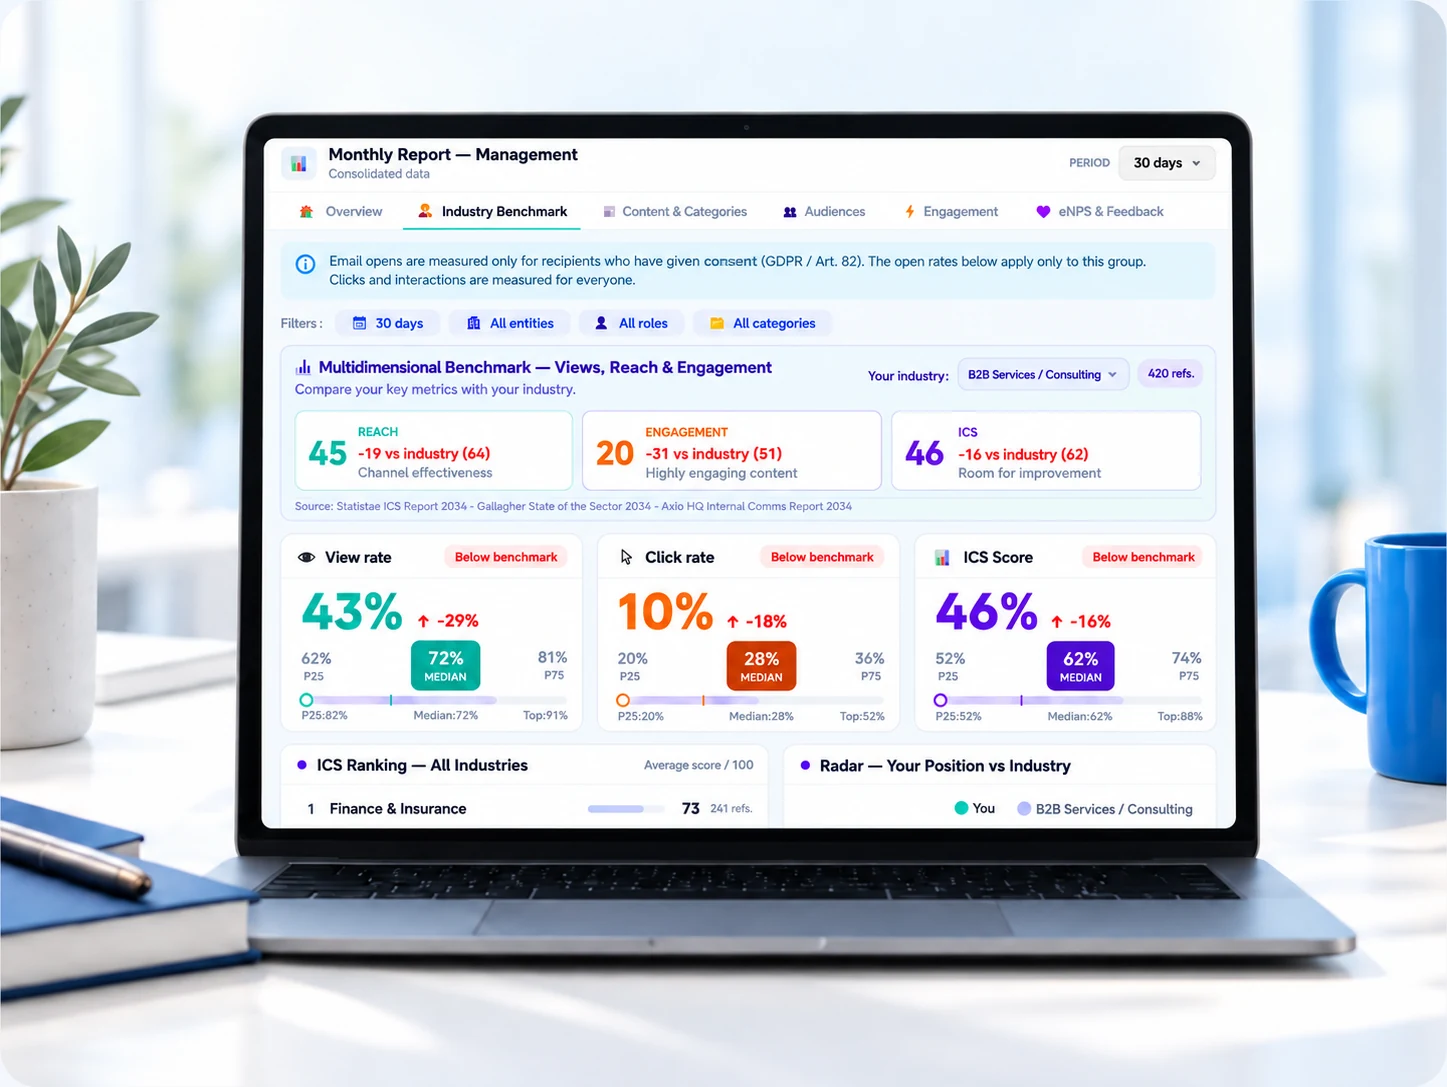
What you need to know, and what you can do about it.
Every communication, every population, every month.
By communication
Reads, clicks and responses for each newsletter, message, quiz or survey, compared with your averages.
By population
Head office, branches, sites, jobs: spot the teams your messages are not reaching.
Over time
How reading evolves month after month, and the effect of changing your channels or pace.
A report you can read in two minutes, with an action plan.
No more dashboards nobody can read. Every month, AI analyses all your communications and writes a clear report, ready to share with your management.
Useful analysis, respectful use.
The figures are calculated, AI explains them
All statistics are calculated by the platform. The AI produces no figures: it interprets them and puts them into words.
Solid signals
Reads on the intranet and app, responses, clicks: the report relies on reliable measures and states its own limits.
Never individual analysis
Results are presented by population, never by person, and are not shown for groups that are too small.
Questions about statistics.
Can the AI get the figures wrong?
No, because it does not calculate them. The statistics are produced by the platform, then passed to the AI, which comments on them. Every statement in the report links back to the figure that supports it.
Is the data used to assess employees?
No. Statistics measure the reach of your communication, not people. Results are presented by population, and no result is shown for a group too small to preserve anonymity.
How is email reading measured?
Through clicks on links and, as an indication, through opens. Opens are presented as estimates, because some email clients block or simulate them.
Can we share the report with management?
Yes. The monthly report is designed to be read in two minutes and can be exported for your presentations.
Do you know who actually reads your messages?
In 30 minutes, we show you what your current statistics do not tell you, and what a monthly report would change.